Every weekday evening, our editors guide you through the biggest stories of the day, help you discover new ideas, and surprise you with moments of delight. Subscribe to get this delivered to your inbox.
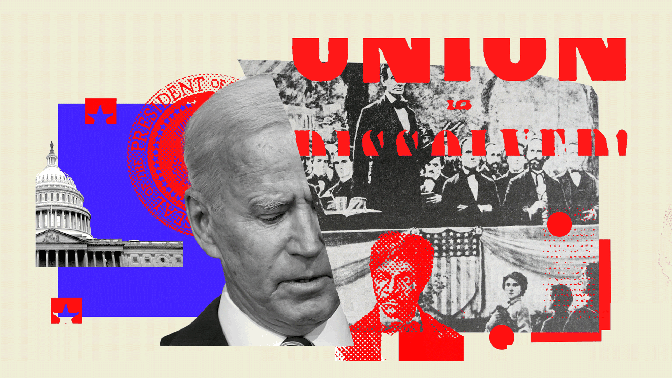
America’s political schisms are so profound that we risk a repeat of the 1850s, when the country was on the precipice of the Civil War.
Two Atlantic writers warn that the 2020s could mark another dangerous decade for the American experiment. This time, the split is between those who embrace the country’s diverse future and those who fear it.
Should Donald Trump win, America will enter an 1850s-style death spiral.
On the left and right, “extremism will spread, mutate into new forms, and gradually become entrenched in more areas of American life,” Anne Applebaum argues.
A Joe Biden victory wouldn't necessarily soothe the nation's wounds.
Especially if the GOP deepens “its reliance on the most racially resentful white voters,” Ronald Brownstein writes.
Further reading: In retrospect, The Office’s Dwight Schrute was a bellwether for this tense new period in American politics, Megan Garber argues.
1. Watch a scary movie.
Here are 25 of the best horror films you can stream, ranked by scariness.
2. If you plan to celebrate, be sure to take precautions.
“In much of the country, staying home is still the safest choice,” our health writer Amanda Mull warns. If you decide to trick-or-treat, plan with your neighbors to modify the activity for safety.
3. Read a scary book.
Our weekly guide to the best in books celebrates the genre’s masters of fright, including Maurice Sendak, R. L. Stine, and Stephen King.
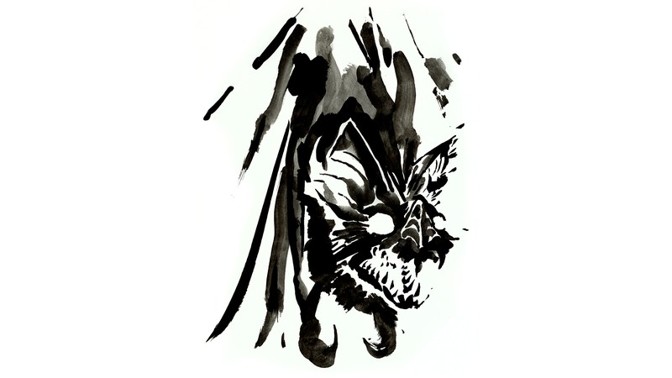
4. Familiarize yourself with everything that crawls, slithers, or shrieks in the night.
Explore the evolutionary roots of our fear of bats. Meet the kingsnake—and find out how it got its name. Tap into a black widow spider’s shudder-inducing sixth sense.
5. Eat all the candy.
And while you do, read this delightful story on how children assign value to various treats. No, we will not trade our Snickers for your Tootsie Roll.
6. Prepare yourself for the end of daylight saving time.
Avoid an unnecessary Sunday scare by planning your bedtime accordingly on Halloween night. As if by witchcraft, clocks will jump backwards by an hour. (We know; we hate it too.)
Thanks for reading. This email was written by Caroline Mimbs Nyce, with help from Haley Weiss.
Did someone forward you this newsletter? Sign up here. Need help? Contact Customer Care.
Looking for an easy-to-make cocktail for Halloween? Our deputy editor Ross Andersen recommends the Bobby Burns, a spiced and smoky blend of scotch, sweet vermouth, and Bénédictine, stirred and served up in a chilled coupe glass. If you aren’t drinking, try iced ginger beer with bitters instead. Either will pair well with the pop and crackle of a fire and Donna Tartt’s The Secret History, the perfect autumn novel.
Comments
Post a Comment