
Equal Earth map projection

There’s no perfectly satisfying way to map the globe on to a flat surface. Every projection has its advantages and disadvantages. The Mercator projection, for example, is much maligned for the way it distorts area, but it has the property that lines of constant bearing correspond to straight lines on the map. Obviously this is convenient if you’re sailing without GPS. But for contemporary use, say in a classroom, minimizing area distortion is often a higher priority than keeping bearing lines straight.

Bojan Šavrič, Tom Patterson, and Bernhard Jenny have developed a new map projection called Equal Earth that nicely balances several competing criteria, including aesthetics.
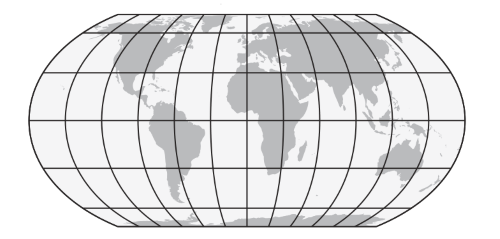
Equal earth projection

The Equal Earth projection satisfies the following mathematical criteria:

  1. Equal area: The area of a region on the globe is proportional to the area of its projection.
  2. Straight parallels: Lines of equal latitude project on to horizontal lines.
  3. Regularly distributed meridians: At a given latitude, the spacing between lines of longitude are equal.
  4. Bilateral symmetry: The projection is symmetric with respect to the x-axis (equator) and y-axis (prime meridian).

Here are the equations for the Equal Earth projection.
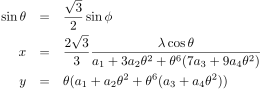
\begin{eqnarray*} \sin\theta &=& \frac{\sqrt{3}}{2} \sin \phi \\ x &=& \frac{2\sqrt{3}}{3} \frac{\lambda \cos \theta}{a_1+ 3a_2 \theta^2 + \theta^6(7a_3 + 9a_4\theta^2)} \\ y &=& \theta (a_1 + a_2\theta^2 + \theta^6(a_3 + a_4\theta^2)) \end{eqnarray*}

Here λ and φ are longitude and latitude respectively. The parametric latitude θ is introduced for convenience and is simply a rescaling of latitude φ.

The parameters ai are given below.

    a_1 =  1.340264 
    a_2 = -0.081106 
    a_3 =  0.000893 
    a_4 =  0.003796 

You can find more in their paper: Bojan Šavrič, Tom Patterson, and Bernhard Jenny. The Equal Earth map projection. International Journal of Geographical Information Science. https://doi.org/10.1080/13658816.2018.1504949.

Related posts


from John D. Cook https://ift.tt/2OZRXSr
via IFTTT

Comments

Popular posts from this blog

Controlling legend appearance in ggplot2 with override.aes

[This article was first published on Very statisticious on Very statisticious , and kindly contributed to R-bloggers ]. (You can report issue about the content on this page here ) Want to share your content on R-bloggers? click here if you have a blog, or here if you don't. In ggplot2 , aesthetics and their scale_*() functions change both the plot appearance and the plot legend appearance simultaneously. The override.aes argument in guide_legend() allows the user to change only the legend appearance without affecting the rest of the plot. This is useful for making the legend more readable or for creating certain types of combined legends. In this post I’ll first introduce override.aes with a basic example and then go through three additional plotting scenarios to how other instances where override.aes comes in handy. Table of Contents R packages Introducing override.aes Adding a guides() layer Using the guide argument in scale_*() Changing multiple aesthetic par...

Using RStudio and LaTeX

(This article was first published on r – Experimental Behaviour , and kindly contributed to R-bloggers) This post will explain how to integrate RStudio and LaTeX, especially the inclusion of well-formatted tables and nice-looking graphs and figures produced in RStudio and imported to LaTeX. To follow along you will need RStudio, MS Excel and LaTeX. Using tikzdevice to insert R Graphs into LaTeX I am a very visual thinker. If I want to understand a concept I usually and subconsciously try to visualise it. Therefore, more my PhD I tried to transport a lot of empirical insights by means of  visualization . These range from histograms, or violin plots to show distributions, over bargraphs including error bars to compare means, to interaction- or conditional effects of regression models. For quite a while it was very tedious to include such graphs in LaTeX documents. I tried several ways, like saving them as pdf and then including them in LaTeX as pdf, or any other file ...