Once in a while you’ll hear of someone doing a digital detox, which implies there’s something toxic about being digital. And there can be, but “digital” misdiagnoses the problem. The problem mostly isn’t digital technology per se but how we use it.
I think the important distinction isn’t digital vs. analog, but rather push vs. pull, or passive vs. active. When you’re online, companies are continually pushing things at you: ads, videos, songs, shopping recommendations, etc. You either passively accept whatever is pushed at you, and feel gross after a while, or you exert willpower to resist what is being pushed at you, and feel tired.
Information overload
I find it relaxing to walk into a library with millions of books. There’s an enormous amount of information in a library, but it’s not being streamed at you. You have to actively access it. An electronic catalog is far easier to use than an analog card catalog, and the introduction of digital technology does not induce stress. If anything, it reduces stress. (As long as the catalog is not down for maintenance.)
A single web page can induce a stronger sense of information overload than an entire library, even though the former contains a negligible amount of information compared to the latter.
Twitter vs RSS
Twitter can be stressful in a way that RSS is not. Both are digital, but RSS is more active and Twitter is more passive.
RSS gives you content that you have deliberately subscribed to. Your Twitter stream contains updates from people you have chosen to follow, but also unwanted content. This unwanted content comes in several forms: unwanted content from people you chose to follow, retweets, and worst of all tweets that people you follow have “liked.” You can turn off retweets from people you follow, but you can’t avoid likes. Twitter also has ads, but I find ads less annoying than the other unwanted content.
When an item shows up in your RSS feed you make a choice whether to open it. But Twitter content arrives already opened, including photos. I’ll subscribe to someone’s RSS feed even if I’m interested in only one out of twenty of their posts because it is so easy to simply not read the posts you’re not interested in. But if you’re only interested in one out of twenty things people say on Twitter, then your stream is 95% unwanted content.
Instant messaging vs Email
Instant messaging and text messages are more stressful than email, at least in my opinion. This is another example of passive versus active. The more active option, while perhaps less convenient, is also less stressful.
IDEs vs editors
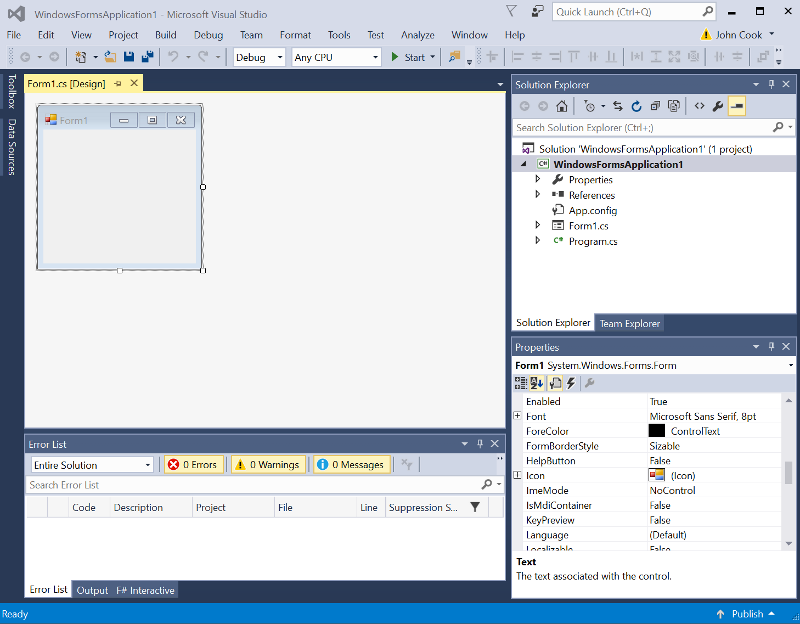
An IDE (integrated development environment) is a program like Visual Studio that helps you write software. There are scores of menus, buttons, and dialogs to guide you in developing your code. If you’re doing the kind of software development an IDE is designed for, it can be very useful. But I also find it stressful. I feel like options are calling out “Pick me! Pick me!”
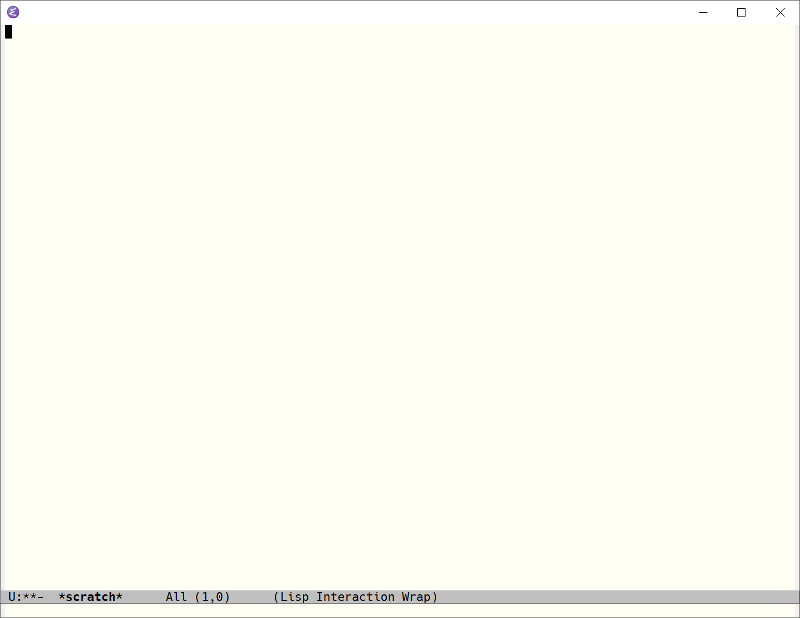
Text editors stay out of your way, but they also don’t offer any help. The Visual Studio IDE and the Emacs editor are both enormous programs, but the former feels more passive and stressful to me. Emacs, for better and for worse, is more active. It has thousands of commands, but they’re not staring at you on buttons. You have to type them. This makes it much harder to discover new features, but it also makes the software more peaceful to use.
Here’s what the two programs look like when you open them. First Visual Studio:
And now Emacs:
Digital vs online
Using a computer is not the same thing as being online. As far as I know, nobody talked about the need for a digital detox before the web. People who say they’re worn out by digital technology are mostly worn out by social media. Computers have a few other uses besides being social media portals.
In the television series Battlestar Galactica, the protagonists had a rule that computers must not be networked. Computers were essential, but they must never be networked, in order to prevent attack from Cylon androids. Some people have a sort of personal Battlestar Galactica rule, working for long periods of time without an internet connection.
An alternative is to make disciplined use of an internet connection, for example, using it for email but not for social media. Unplugging the network cable takes less decision making and less discipline, but it’s harder to do. For example, it’s common for software to not have local documentation, so you may need to go online for help.
Conclusion
Much of the stress attributed to digital technology comes from passive use of the technology rather than the technology itself. There are benefits to walking away from computers periodically that this post hasn’t discussed, but most of the benefits of a digital detox come from a social media detox.
from John D. Cook https://ift.tt/2PD0Q48
via IFTTT
Comments
Post a Comment