You’ll need:
- Dishcloths (could use any cotton cloth but slightly thicker is better)
- 20 gauge metal wire cut into 2.5″ pieces (could use pieces of a thin wire hanger instead)
- Elastic cord (could use rubber bands or strips of cloth instead)
- A sewing machine
- Good scissors
- Crochet needle and sharpies
- Cardboard
I’m following the pattern for “Mask 2 (large)” on this webpage. But to be honest I found it hard to follow which is why I’m going to tell you quite plainly how to do this relatively quickly.
First, download and print this pdf: mask+2+large+pattern
Or simply eyeball the following picture with the ruler as a guide:

You’ll want to cut out the printed version and then outline it onto cardboard, then cut out the cardboard so you’ll have a form you can reuse a bunch of times with sharpies:

This has been used a bunch and is kind of a mess. That’s ok.
Then you outline with a sharpie on your dishcloth:

I got 12 cardboard outlines on! That means 3 masks. Be sure to avoid the hemmed edges.
Next you cut them all out:

Next, pair up the cloth pieces to match:


Next, sew along the foot of those matched boots for both pairs with a 1/4″ seam:

And now put those two pieces together, with the seams on the outside for both pieces:
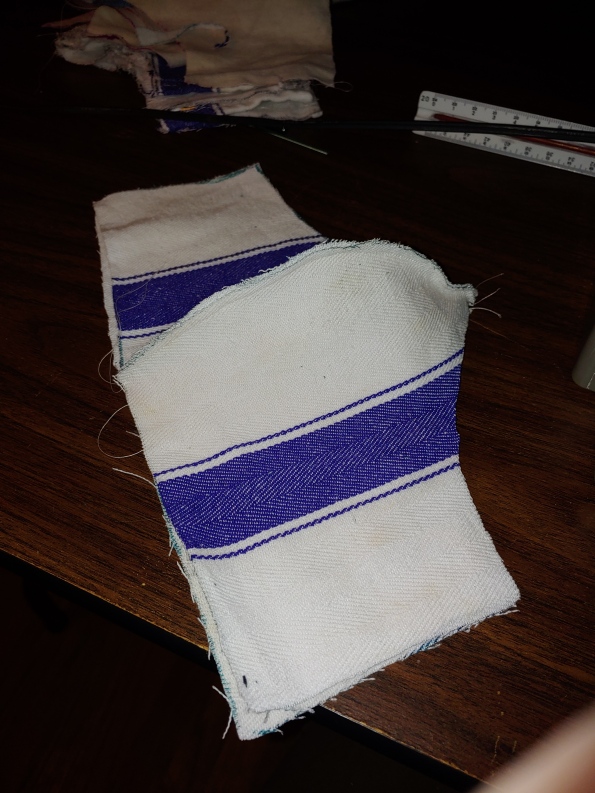
Next, sew all around the above piece (so sew the two pieces together) with a 1/4″ seam except for about two inches at the bottom seam:

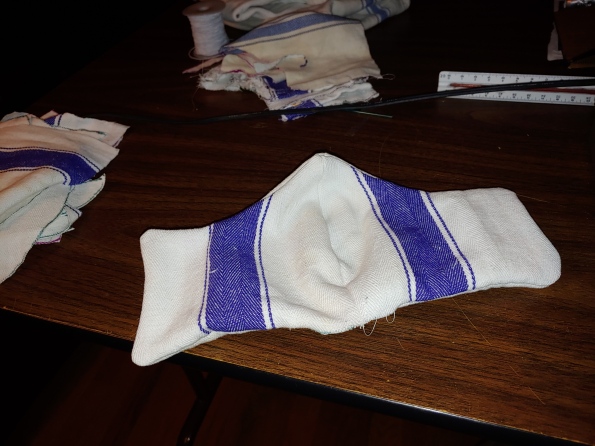
It’s time to turn this whole thing inside out by squeezing it through that two inch slit!

Poke your fingers into all four corners plus the nose part at the top to make sure it’s all the way inside out.
Here’s the other side:
Next, sew a three inch line along the nose top (a 1″ seam) and stick the metal wire into that channel:
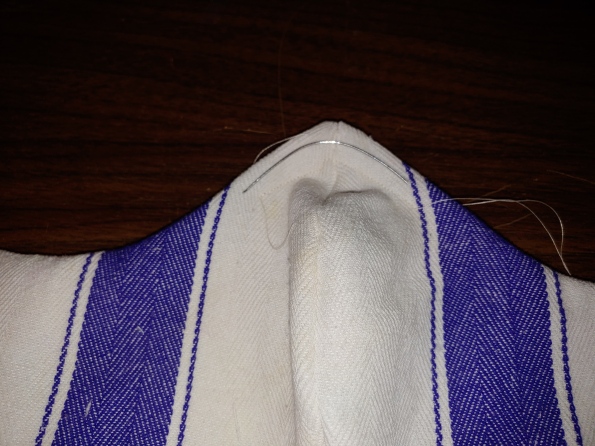
Do you see the channel? The wire has to go in this area except, of course, you need to have it on the inside.
Next, you want to sew along the entire edge (very close to the edge, maybe 1/4″), starting at one end of the nose wire channel. Halfway along you’ll carefully close the hole at the bottom:

Here it is at the end:

this picture is overexposed but the idea is you close up the nose wire channel on both sides.
Next, you fold back 1.5″ of the ear flaps and sew down:

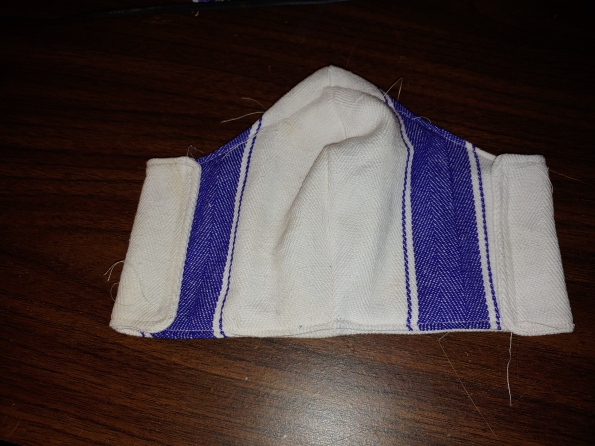
This is the back of the mask after sewing down both flaps.
Next, measure out 1 yard of elastic cord and tie together the ends:

Next, use a crochet needle to pull through flaps and then tie it together:


Finally, yank the elastic cord until it’s hidden inside a flap and tidy everything up by snipping off the stray threads.

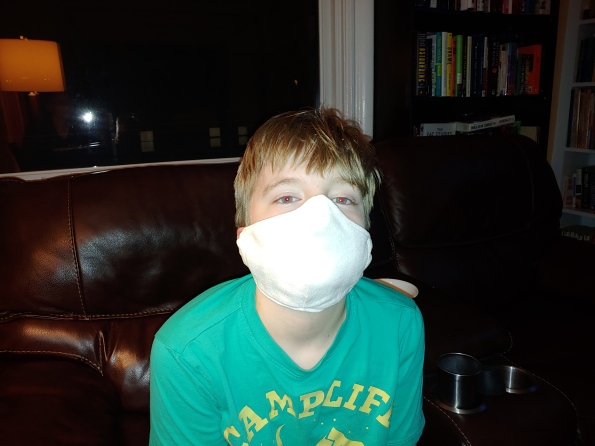
It’s ready for a cute model!

Now’s the time to squeeze the metal wire to make it fit your nose.
from mathbabe https://ift.tt/2R8UpJ5
via IFTTT
Comments
Post a Comment