Elliott writes:
Postal voting could put America’s Democrats at a disadvantage: Rejection rates for absentee ballots have fallen since 2016, but are higher for non-whites than whites
The final impact of a surge in postal voting will not be known until weeks after the election. Yet North Carolina, a closely contested state, releases detailed data on ballots as they arrive. So far, its figures suggest that a tarnished election is unlikely—but that Democrats could be hurt by their disproportionate embrace of voting by mail. . . .
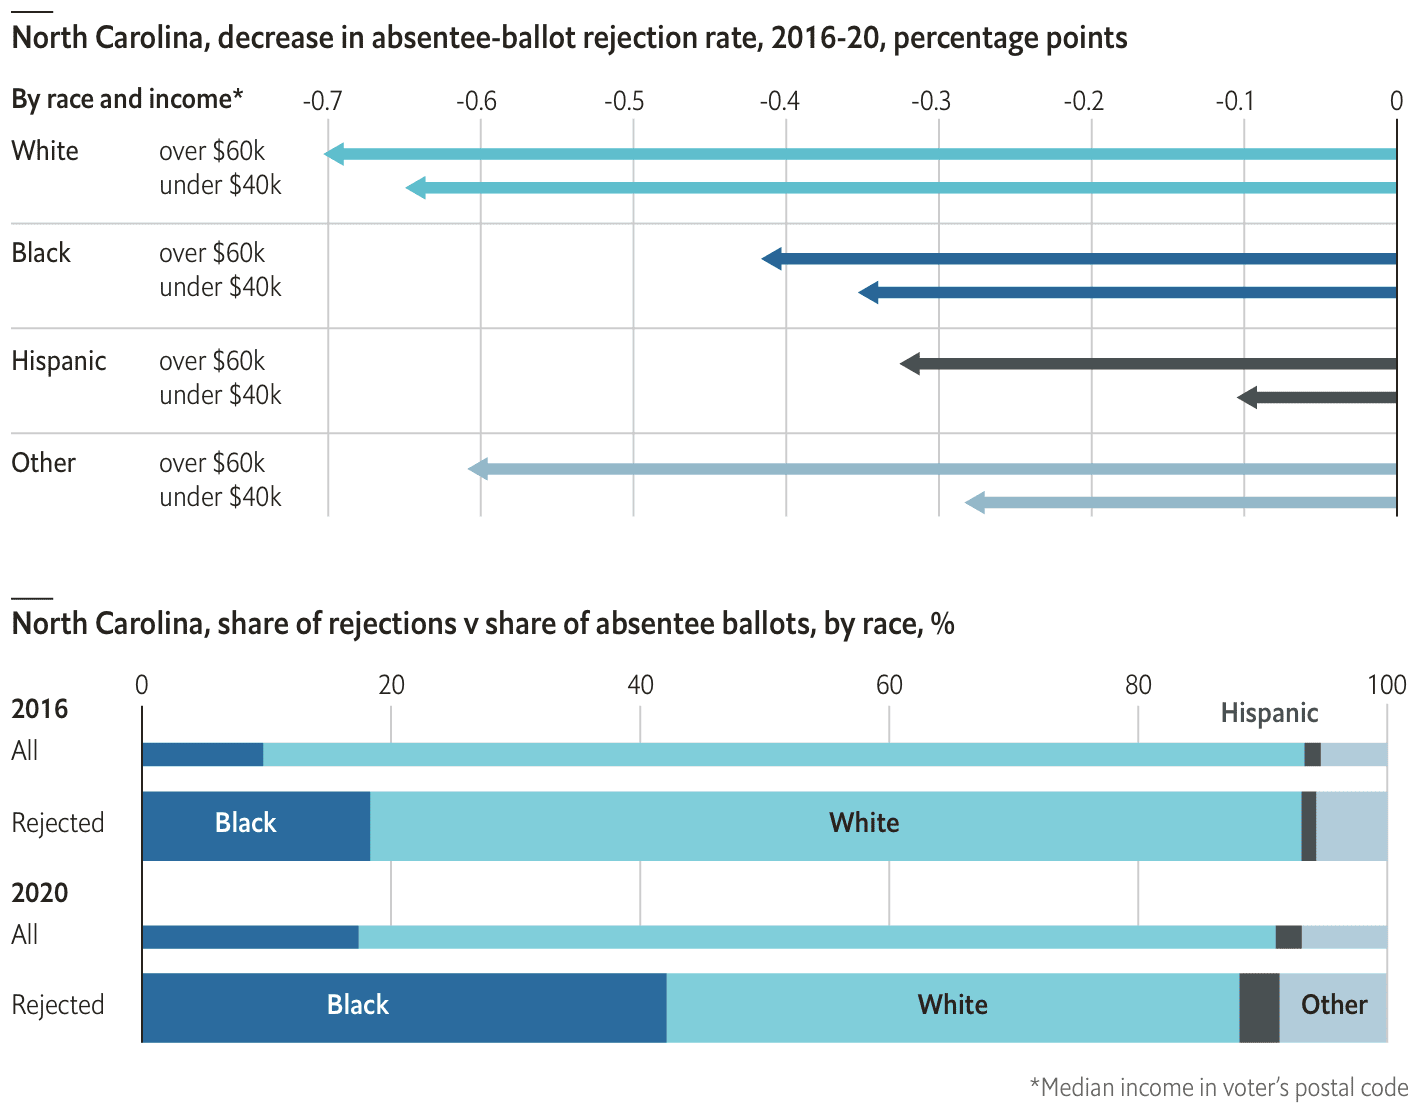
The Tar Heel state has received eight times as many postal votes as it had by this point in 2016. Despite fears about first-time absentee voters botching their ballots, the share that are rejected has in fact fallen to 1.3%, from 2.6% in 2016. This is probably due in part to campaigns educating supporters on voting by mail, and also to new efforts by the state to process such ballots.
However, these gains have been concentrated among white and richer voters, causing North Carolina’s already large racial gap in rejection rates to widen. In 2016 black voters sent in 10% of postal ballots, but 18% of discarded ones. This year, those shares are 17% and 42%. That hurts Democrats, who rely on black voters’ support. . . .
Partisan differences over voting by mail exacerbate this effect. In the past, Democrats and Republicans were equally likely to do so. But polling by YouGov now shows that 51% of likely Democratic voters plan to vote absentee, compared with 32% of Republicans. Extrapolating North Carolina’s patterns nationwide, a model built by Merlin Heidemanns of Columbia University finds that 0.7% of ballots intended for Joe Biden, the Democrats’ presidential nominee, will be rejected postal votes, versus 0.3% of those cast for Donald Trump. . . .
Kyle Hausmann saw the above-linked article and asked if we had any thoughts on how impactful that might be on the election outcome. He also asked “whether or not trends in ballot rejection might already be implicitly baked into your economist forecast, simply by virtue of the rejected ballots not being included in the historical voter count date.”
Merlin replied:
Elliott and I expect the overall number of rejected ballots to be higher and for Democrats to be disproportionately negatively affected because rejection rates are larger within the groups that tend to vote for them and because they are more likely to vote absentee to begin with. While an equity issue, we don’t expect this to meaningfully affect the outcome of the election given that it primarily affects states that are safely Democrat aside from one or two that are mentioned in the article. I did some work on this for USA Today and did some further exploratory analysis of the NC data here and some raw number rejections by ethnic group based on 2016 data here .
It’s not baked into our forecast because vote-by-mail numbers will be at a historic high this year.
from Statistical Modeling, Causal Inference, and Social Science https://ift.tt/2HuEa7t
via IFTTT
Comments
Post a Comment