Every weekday evening, our editors guide you through the biggest stories of the day, help you discover new ideas, and surprise you with moments of delight. Subscribe to get this delivered to your inbox.
This pandemic never stopped being serious. But the situation just got more so.
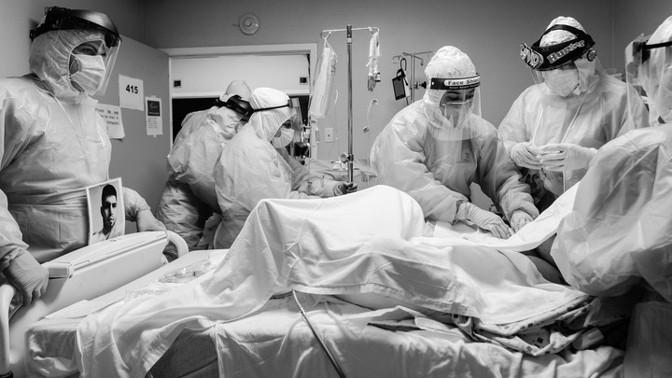
COVID-19 hospitalizations are up to an all-time high, and with them, fears that America’s hospitals could be overwhelmed. Unlike in the spring, the hot spots aren’t contained to a region, my colleagues at the COVID Tracking Project write: 17 states are reporting peaks.
That could make it “harder to mobilize surges of frontline workers to areas where health-care systems are at risk of failure.”
In better news, a vaccine looks more promising than ever. Until then, Americans must once again assume the role assigned to them in March: Taking precautions to alleviate the strain on the country’s health-care system.
-
Here’s how to tell if socializing indoors is safe. “Perhaps the most important factor is the level of so-called community transmission: how many new COVID-19 cases are in your immediate area,” Olga Khazan reports.
-
There’s a difference between feeling safe and being safe. The pandemic has broken America’s understanding of what to fear, Amanda Mull argued last month.
-
Even before the latest surge, experts advised against travel for the holidays. If you do decide to go home, consider taking these seven precautions to mitigate risk.
-
Struggling to tell loved ones you won’t be able to celebrate together? We asked one expert for advice on how to have that difficult conversation.
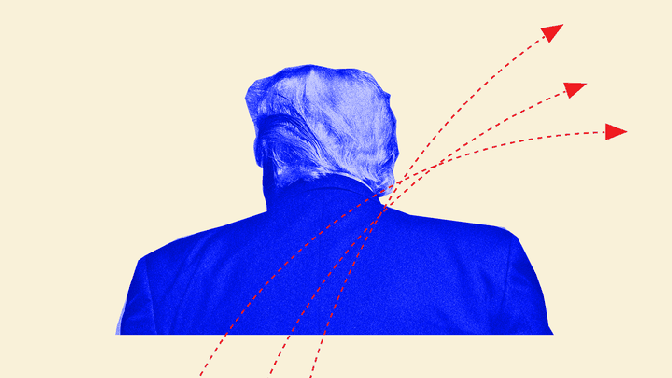
President Donald Trump still has not conceded the 2020 election. Here’s what our writers are thinking about:
The president’s litigation strategy is unlikely to succeed, Richard L. Hasen, an election-law expert, argues. But it will sow chaos in the meantime.
Meanwhile, two lawyers argue that no self-respecting attorney should touch Trump’s claims.
One question, answered: How should one ventilate their home during a pandemic?
This summer, our contributing writer Zeynep Tufekci wondered why experts weren’t offering more guidance around ventilation, given concerns of airborne transmission.
Before COVID-19 hit, Craig Mod, a writer based in Kamakura, Japan, intensely modified his home airflow to prevent summer mold. He applied his learnings to the outbreak:
Thankfully, you can create safer air without going to my extremes. If you can’t afford in-window vents, just crack as many windows as possible. Open doors between single-window rooms to help establish gradients. Do this even with the air conditioner on, or the heater come winter. Yes, it’s less energy efficient, but even one cracked window will slowly replenish stagnant air. Two cracked windows help the air better figure out how to move. You can also augment the quality of air in a single-vent room by adding a HEPA filter, which has been shown to effectively reduce dangerous aerosols.
Continue reading Craig’s piece.
Stuck on what stream? Let us help:
Netflix’s The Crown is back this Sunday. “In its sharp and splashy fourth season, the show finally criticizes [Queen] Elizabeth for her ignorance,” our critic Shirley Li writes.
Today’s break from the news:
Sure, single-celled organisms can clone themselves, but they can also reproduce sexually. Learn more about the sex lives of eukaryotes.
Did someone forward you this newsletter? Sign up here.
Comments
Post a Comment